
Meteorology
METEOROLOGY
Introduction
This Chapter on Meteorology covers the basic meteorology syllabus. For further reading we suggest you obtain one of the many good publications out there. We recommend the book "Weather to Fly for Recreational Pilots" by W. J. Wagtendonk. Copies are available from the author at 155 Waipapa Road, Omokoroa, Tauranga.
The weather and its changing patterns has always been of interest to man. However, the degree of importance attached to it varies considerably between individuals. For example, a traveller by road or rail is only ever hampered by the severest of weather, whereas the pilot in his aircraft can have his flight affected by even slight changes in weather conditions. One could say that the ground traveller travels underneath the weather, while the pilot travels through the weather itself.
Weather conditions play a vital role in the operation of microlight aircraft. To safely plan a microlight flight knowledge of the anticipated weather conditions is a basic requirement and because weather forecasts cannot be guaranteed, either in their accuracy or availability, the pilot must develop a basic understanding of the elements involved in weather prediction, so that he/she can make sensible decisions prior to and during flight. The competent aviator has a sound knowledge of and respect for the weather and its relation to flight operations.
A microlight is an aeroplane and it operates in the environment of the air just like any other aircraft. It is therefore essential that a microlight pilot is aware of the problems which result from deteriorating weather and has a basic understanding of how changes in the weather conditions can affect his operations. This does not mean that pilots have to be meteorologists, but rather they must have a basic knowledge of the weather elements and how they interact to produce good or bad flying conditions. They will also need to know the limitation of the weather forecasting services and be familiar with the methods of obtaining weather reports and forecasts.
Although it is the responsibility of the Meteorological Service to provide weather information to pilots in the form of forecasts and reports, it will always remain the pilot's individual responsibility to make wise decisions in respect of whether a planned flight can safely be made.
To the pilot, Aviation Meteorology could be summed up as consisting of four basic elements:
- Visibility.
- Cloud Base.
- Precipitation.
- Wind Velocity.
However, a pilot's role in relation to safe flight operations cannot be achieved unless he is conscious of how these elements may affect his own limitations and those of his aircraft. Therefore, although the information in the following pages is part academic and part practical, it must be understood by any pilot if he is to become capable of assessing the hazards associated with various weather phenomena. Ignorance of this will lead him to taking chances, which in turn can easily result in the occurrence of dangerous in�flight situations.
Aviation forecasts and reports
The Meteorology Service provides two main aviation weather services to pilots:
- Information on current weather (reports).
- Information on expected future weather (forecasts).
The distinction between the two functions should be clearly understood.
Obtaining Weather Briefings (Reports and Forecasts)
Weather briefings are obtainable online from the MetFlight GA website.
- Go to http://metflight.metra.co.nz/MetFlight.php
- Log in with your user name and password (obtainable from RAANZ)
- Click on the areas for which you require weather information
- Select the types of weather briefings you equire (ARFOR, TAF, METAR, SIGMET)
- Click on Get weather briefing to get the selected information
- You have the option of receiving the briefing in plain English
- You can also select 'movies' of immediate past and current satellite and rain radar images.
Area Forecasts (ARFORs) are issued daily and on any significant change in forecast. They give you an overview of the weather situation and the expected weather for the area. It can be useful to get forecasts for adjacent areas if changeable weather is on its way.
Terminal Area Forecasts (TAFs) are forecasts for major controlled airfields in the areas selected.
METARs are hourly reports from most controlled airfields throughout N.Z. They are also available while in the air. If in doubt, ask for a Metar Report. They are usually available around 10 to 15 minutes after the hour. If your destination does not issue Metars then obtaining one from the nearest manned aerodrome could be of use.
SIGMETs are a heads-up on significant meteorological information (thunderstorms, severe wind, windshear, cloudbase, visibility, etc) in the area. They are issued as required.
No pilot should take off on a cross�country flight without a complete understanding of the ARFOR for his route; TAF for his destination; METARs for his destination, alternate and en�route airfields; and any SIGMETs applicable to his route and destination.
You can also obtain unofficial weather information from a number of other sources. While these are not a substitute for a proper aviation forecast, they can help give you a more complete understanding of the weather you can expect enroute. And there is value in a phone call to someone you trust at the destination field to give you a microlight pilot's perspective on the weather.
The Weather Map
The weather map is the foundation of forecasting. It is simply a map showing weather conditions over an area. Maps are normally updated every few hours. The weather information used in the preparation of a weather map consists of simultaneous observations of such elements as wind direction and speed, cloud form, amount and height, temperature, pressure, visibility etc, taken at a number of stations distributed over a wide area, supplemented with satellite and weather radar data. When this information has been plotted on the chart and the isobars, fronts, etc have been added, the completed chart presents a view of the actual or expected general weather situation.
The weather map below gives a general picture of the weather situation over NZ at a given period.
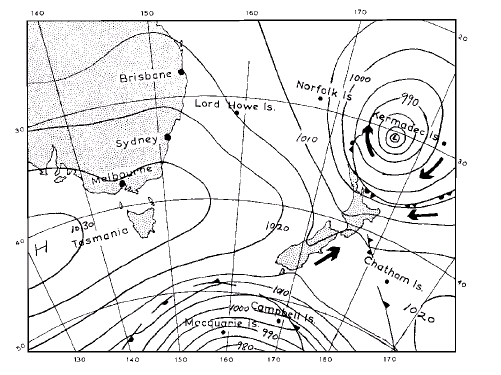
Fig. 89
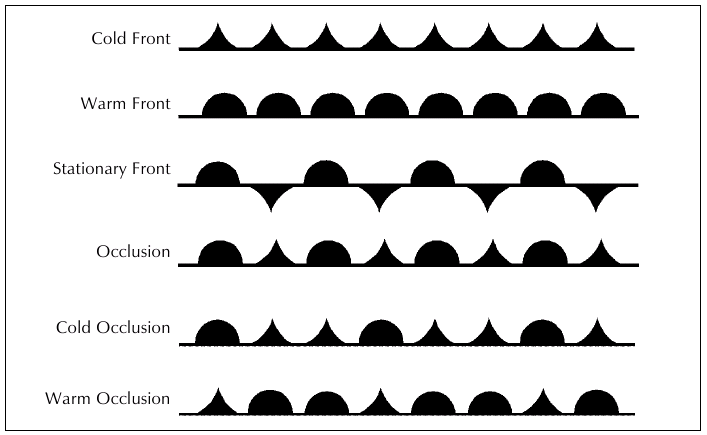
Fig. 90 Frontal Symbols.
The Atmosphere
The atmosphere of the Earth is comprised of approximately 80% volume Nitrogen and 20% Oxygen. It contains a small but very variable amount of water vapour which by changing into water droplets or crystals, can form fog, rain, hail, snow, etc.
Atmospheric Pressure
The weight of the atmosphere above results in what is known as atmospheric pressure. At sea level this pressure is approximately 14.5 psi or 1013 hPa. To facilitate the calibration of altimeters this pressure is commonly expressed in hectopascals (aka millibars.
Barometric pressure decreases with height- it also varies from day to day and place to place, but is assumed to be 1013.2 millibars in the Standard Atmosphere at sea level.
The Standard Atmosphere is one of the assumed conditions for the calibration of instruments. It is sometimes referred to as the ISO or ICAN standard atmosphere and it assumes the following:
- a sea level pressure of 1013.2 hPa
- a decrease in pressure of 30hPa per 1000ft
- a sea level temperature of 15 degrees Celsius
- and a decrease in temperature (lapse rate) of 2 degrees C per 1,000ft.
Atmospheric pressure is the force per unit exerted by the weight of the atmosphere. Since air is not solid it cannot be weighed with conventional scales. Instead it is measured by means of either a mercury or aneroid barometer, or an absolute pressure transducer.
The mercury barometer is very accurate but too bulky for use in aircraft, so aircraft altimeters are the aneroid type. The aneroid barometer consists of a flexible bellows which is sealed after most of the air has been extracted from it. The bellows contracts or expands in response to the air pressure exerted on it. Electronic altimeters generally use a pressure transducer which has a microscopic version of an aneroid barometer- a sealed chamber etched into the silicon chip with strain gauges measuring the deflection of the chamber walls.
Air Density
The rarified air at greater heights in the atmosphere is lighter than air near the ground. Its density is less.
- The less the pressure the less the air density.
- Also the greater the air temperature the less the air density.
Aircraft and engine performance suffer in reduced air density (density altitude).
As air density and pressure at around 10,000ft is only about 3/4 of normal MSL (Mean Sea Level) value, above this altitude lack of oxygen can cause the pilot and passengers adverse physiological effects. We therefore do not fly without oxygen above 10,000ft.
The Pressure Altimeter
The dial of an aneroid barometer can be graduated in feet instead of units of pressure and the instrument can then become an altimeter. As the change of pressure with gain in altitude is not constant, the altimeter is constructed to read correctly under certain conditions known as the International Standard Atmosphere (ICAN).
This assumes:
- A sea level pressure of 1013.2 mbs at 15 degrees C.
- A temperature drop with height of 2 degrees C per 1,000ft.
- Up to approximately 36,000ft above which the temperature is assumed to remain constant at -56.5 degrees C.
As the above conditions do not always prevail, for instance at times the air temperatures may remain constant or even increase with height, altimeters are not always completely accurate.
Altimeter Subscale Settings
Altimeters can be expected to give the correct reading when they have been correctly set. That is, the position of the needle adjusted to read zero when the altimeter is at the airfield level when carrying out circuit practice (QFE), or to read the airfield height above sea level when on the airfield if doing cross country or local flying (QNH). These settings depend on the air pressure which varies, so the correct pressure setting also varies. Different pressure settings can be adjusted by use of the knurled knob to set the correct pressure in the altimeter subscale box.
QFE
When an altimeter is set to read zero on a particular airfield, when airborne it will indicate the height of the instrument/aircraft in relation to the airfield. This setting is known as QFE and in NZ is sometimes used for circuit flying ONLY.
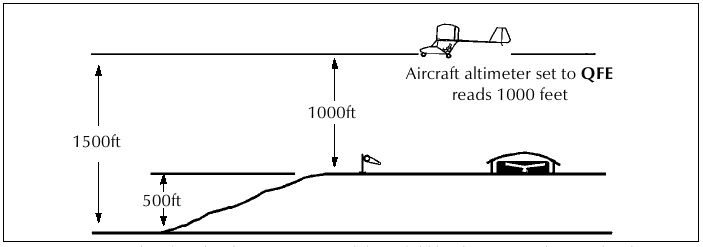
Fig. 91 QFE is where the altimeter is set to read the airfield level pressure. When set the altimeter will read zero on the airfield.
QNH
When the altimeter is set to read the height of the airfield above MSL (mean sea level) when airborne it will indicate the height of the aircraft above MSL This setting is used at all times in NZ except occasionally during circuit practice.
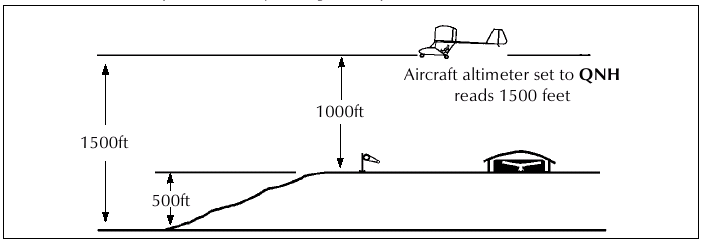
Fig. 92 QNH is where the altimeter is set to airfield level pressure converted to MSL pressure using the ICAN atmosphere.
The altimeter when set on the field will read the height of the airfield above MSL. Values of QNH are always available from Air Traffic Control as required and are the pressure settings always given unless otherwise requested by the pilot. The area QNH is normally given by ATC upon every radio contact and acknowledged by the pilot by reading back.
As an aircraft climbs the pressure decreases and the altimeter indicates an increase in height. Therefore, when flying from an area of high pressure to an area of low pressure the altimeter will read high and vice-versa.
Remember:
- High � Low � High = When flying from high to low pressure the altimeter will read high.
- Low � High � Low = When flying from low to high pressure the altimeter will read low.
Isobars
We have learnt that the atmosphere has weight, and due to the uneven heating of the earth's surface the atmosphere tends to "pile up" or "thin down" in various places causing a direct effect on the weather. The horizontal pressure differences between these air masses provide the force which moves the air over the earth's surface and so produces wind.
Due to the rotation of the Earth, these air masses tend to move in certain general directions in various parts of the world. In NZ they tend to move from the West to the East, causing our changes in weather.
Observations of barometric pressure made simultaneously at many locations and corrected to MSL pressure are plotted on weather maps, but the pressure distribution is not apparent until the isobars are drawn in.
An Isobar is a line on a weather (synoptic chart) map joining places of equal pressure at the same height. On your newspaper and TV weather map the isobars are drawn in at MSL. Isobars make up certain well defined patterns to which special names are given.
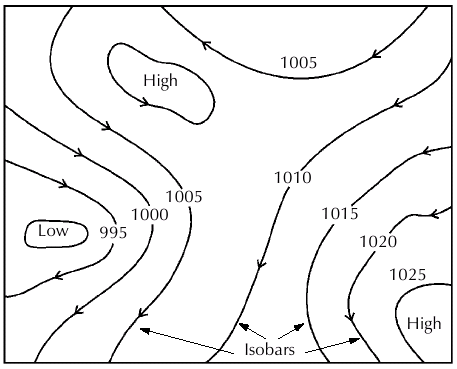
Fig. 93
A Depression or Low is a region of low pressure shown by more or less concentric isobars enclosing an area where the pressure is lowest. The isobars are generally fairly close together. The low pressure draws air into the depression where it is sucked up into the atmosphere in a vortex. Air rotation is clockwise around a low in the southern hemisphere.
An Anticyclone or High is a region of high pressure shown by more or less concentric isobars enclosing an area where the pressure is highest. The isobars are generally further apart. The high pressure air tends to descend and disperse outward. Air rotation is anti-clockwise around a high in the southern hemisphere.
A Trough of Low Pressure is indicated by isobars extending outwards from a low with a higher pressure each side.
A Ridge of High Pressure is indicated by isobars extending outwards from a high with areas of low pressure each side.
These defined patterns, or more correctly, pressure systems, move across from West to East and on succeeding weather maps the pattern of isobars tend to retain their shape, but will be seen to change as depressions deepen or highs intensify. The various types of isobaric configurations are in general associated with certain types of weather and are therefore of particular importance to forecasting. Knowledge of the weather to be expected from the various isobaric configurations can be gained from a regular study of your local newspaper and TV weather map and associated forecast.
For example:
- A high indicates more settled weather over a largish area for longish period of time.
- A low indicates unsettled weather over a medium sized area of shorter duration.
- A ridge indicates settled weather over a smaller area.
- A trough indicates an approaching front and unsettled weather over a localised area.
Air in Horizontal Motion and Wind
Winds are of major importance to microlight pilots. For every takeoff and landing a pilot must consider wind direction, strength and gustiness. On cross�country flights wind must be considered because of its effect on the track and groundspeed.
In a weather report or forecast, wind speed is always given in knots and the direction in degrees true, or in points of the compass. The direction is always given from which the wind is blowing, i.e. 090/25, the wind is from the East blowing at 25 knots.
Generally the wind will back and increase in strength with increase in altitude. A wind is said to back when it changes anti�clockwise and to veer when it changes clockwise.
Gusts are short sudden increases in wind strength and often change in direction. Their cause may be due to mechanical effects such as trees, hangars, etc, or from thermal or frontal activity.
A squall is a blast of wind which sets in suddenly, lasts some minutes, then dies away. They are caused by some weather feature such as moving thunderstorms. Squalls often cause a complete change in wind direction for their duration.
Gales are said to occur when the surface wind has reached an average speed of 34 knots or more.
A Fohn Wind is a warm dry wind blowing down a mountain range. As a prevailing wind blows up a mountain range, it loses its moisture as rain due to adiabatic cooling then goes down the other side gaining heat due to adiabatic heating of dry air. Because there is less moisture in the air on the downwind side, its rate of change in temperature with altitude (lapse rate) is higher, so it heats up more. This is a Fohn wind such as our westerlies and Canterbury's nor�wester.
Land and Sea Breezes
These are a feature of coastal districts in settled weather with sunny days and cloudless nights.
The microlight pilot should be aware that the effects of a sea breeze can be noted 10 or more miles inland from the coast on occasion, and may or may not be anticipated in a forecast.
Sea Breeze
During the day the land heats up more rapidly than the sea. The air in contact with the land heats up by conduction, becomes less dense, and so rises in the form of convection currents or thermals. The colder more dense sea air then begins to flow toward the land to replace the air that has risen. This can set up the on�shore wind we know as the sea breeze, and it occurs during the day, getting stronger as the day progresses, having its maximum strength around mid�afternoon, and dies away towards evening.
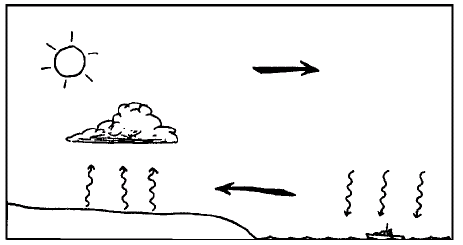
Fig. 94 Sea Breeze.
Land Breeze
A Land Breeze is the reverse of a sea breeze. It tends to occur at night when the land cools more rapidly than the sea and the air over the land becomes colder and more dense than the air over the sea, resulting in a land breeze which sets in only after dark reaching its greatest strength before sunrise.
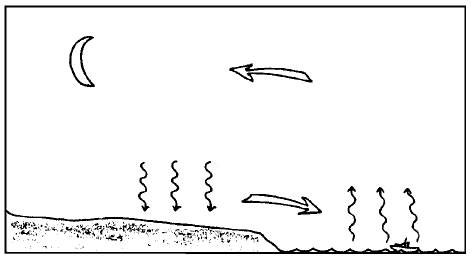
Fig. 95 Land Breeze. The most common small �scale effect experienced in hilly terrain is the daytime upslope winds and the evening downslope breeze.
Anabatic wind
In the morning when the sun begins heating the valleys, the different pressures created in the air causes a light breeze to begin drifting up the slopes of the hills. The upslope wind is known as a valley or anabatic wind. Valley winds are the strongest in summer when the sun's heating is the greatest.
Katabatic wind
Downslope winds are termed catabatic or mountain winds. They occur in the evening when the valleys begin to cool. The air lying over the surfaces of the slope cools and slips downward, filling the valley. As the valley fills, the air in the centre is lifted so that a pilot flying in the evening usually finds a better climb rate in the middle of the valley than above the slope (in the absence of ridge lift).
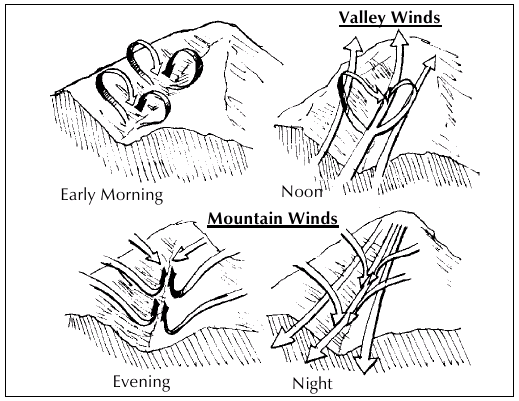
Fig. 96 Circulation due to Solar Heating.
Temperature and Humidity
Air temperature and the way it changes horizontally, vertically, and with time, largely governs the development of the weather. The sun warms the earth by radiation of its heat without heating the atmosphere through which it passes, and the earth in turn warms the atmosphere by conduction. This warm layer of air expands and rises, and thus a thermal is formed. This observed lapse rate can vary considerably in the lower 10,000ft depending whether a cold or warm front has passed through.
Inversion
Generally air temperature decreases as we ascend. If at any time there is an increase of temperature with gain in height, this condition is known as a temperature inversion. An example of this condition is when, during a cold clear night, the air in contact with the ground cools more rapidly than the air at a higher level. This will cause an inversion. If the temperature remains constant as we ascend through an applicable layer, then this is called an isothermal layer.
We can often see an inversion when flying in haze. After a long period of fine anti�cyclonic weather, the upper air has also become warmed and all atmospheric impurities or smoke and dust are trapped beneath the stable layer of inversion.
Water Vapour
The atmosphere contains water vapour which under certain conditions can condense into millions of tiny droplets of water or ice crystals, which construct clouds and fog. Water droplets and ice crystals tend to fall from clouds under the influence of gravity. Some are supported by rising air currents but others reach the ground in the form of rain, hail or snow.
Air is said to be saturated when at a given temperature it contains the maximum possible amount of water vapour. The temperature at which any given parcel of air becomes saturated is known as its dew point. Once air has cooled to its dew point, any further cooling will cause condensation to take place. That is, the water vapour will turn into water droplets, thus forming clouds, fog or ice crystals if the temperature is low enough. Condensation can be seen on a glass of cold drink, when the air comes in contact with the cold glass, it cools to its dew point and condensation occurs.
Relative Humidity
The term used to express the amount of water vapour present in a sample of air, in comparison to the amount that the air could contain at the same temperature before it becomes saturated, that is, reaches its dew point.
Latent Heat of Condensation
When a solid melts or liquid boils to form vapour, heat is absorbed without any rise in temperature. When a liquid solidifies or vapour condenses, heat is given off without any change in temperature. The latent heat of condensation is the amount of heat given off to change a unit mass of vapour into liquid. Therefore, we can expect a cloud that is forming to be giving off heat and thus increasing the convection currents within that cloud.
The opposite applies to a decaying cloud, hence the greater rate of sink experienced under such clouds.
Air in Vertical Motion
The vertical currents of air, or up and down draughts, are all that a glider relies on to climb in and fly through. They also affect a microlight by causing the flight to be turbulent or bumpy. Actually, the knowledgeable microlight pilot can use this lift in the same way as glider pilots do, enabling fast climbs to altitude using little fuel for example.
These vertical currents vary in strength, reaching violently destructive forces in thunderstorms (towering cumulus and cumulonimbus clouds). These clouds must be given a wide berth by microlights as the turbulence generated (especially by cumulonimbus Cb) can extend 15 to 20 miles away!
The danger from these developments cannot be overstressed.
The interior is a freezing hell of incredibly strong vertical currents, hail and lightning. To enter a Cb would probably result in one being turned into a twisted flesh and aluminium hailstone, and that is no exaggeration. Even large aircraft go around Cb's.
Other air in vertical motion exists in the lee of hills and mountains, and is discussed in the turbulence section.
Stability of the Atmosphere
The intensity of vertical air currents depends on the stability of the atmosphere. In a stable atmosphere a parcel of air tends to resist being displaced vertically and if displaced will return to its original height. On the other hand, in an unstable atmosphere, the air so displaced will continue to rise or fall until its temperature reaches that of surrounding air. The stability or instability is a function of the difference in temperature between the surounding air and the parcel of air being lifted. On a hot day the ground heats up and by so doing heats the air in contact with it. This forms a bubble which will evetually break free and rise until its temperatue matches the surounding air. The change in temperature with height of the surounding air is the actual laspe rate.
If a parcel of air is raised for any reason, due to the resulting lowering of pressure it will cool down (like air escaping from a cylinder). If it is lowered (downdraught) due to the resulting increase in pressure it will heat up (like air does when you pump up a tyre). This is known as adiabatic temperature change.
- Dry air will lose 3 degrees for every 1,000ft or approximately 1 degree for each mil ibar change of pressure, this is the dry adiabatic lapse rate.
- Moist or saturated air on the other hand, will only lose 1.5 degrees C for every 1,000ft, this is the moist adiabatic lapse rate. The lower lapse rate is because the water molecules add thermal mass to the air.
Flying Conditions: Unstable Air
A pilot flying in unstable conditions is likely to encounter clouds of the heap or cumuliform type, possibly containing quite violent down draughts, the flight will be bumpy and there is likely to be showers and possibly thunderstorms.
Flying Conditions: Stable Air
A pilot flying in stable conditions will have a smooth flight and any cloud encountered will be of the layer type. The weather will usually be fine although drizzle cloud may occur. Surface visibility will be moderate to poor owing to the concentration of atmospheric impurities beneath the stable layer.
Often fog or mist or haze could be experienced in these conditions. Visibility above an inversion layer or above cloud will be good, but remember it is illegal to operate a microlight above cloud.
Clouds
Clouds are formed when rising air is cooled by expansion until the dew point is reached. Fair weather clouds are formed late morning and afternoon when the air is heated sufficiently that it rises high enough for this to happen. There will be blue days when the lapse rate changes such that the rising of air to the dew point hight is prevented. Clouds can also be formed by air being forced to rise in front of a front or over a mountain range, if fact anything which causes air to rise or cool can cause cloud formation. Not only do clouds obscure ground features and other aircraft, but they often envelop high ground and may be associated with turbulence or ice formation. Cloud cover is Sky clear, Few, Scattered, Broken, or Overcast.
- Sky clear (SKC) = 0/8.
- Few (FEW) = 1-2/8.
- Scattered (SCT) = 3-4/8.
- Broken (BKN) = 5-7/8.
- Overcast (OVC) = 8/8.
- Cloud base is given as the lowest point at which the base is likely to form.
- Cloud base in weather reports and terminals is given as the height above the airfield
level. In route forecasts it is given as the height above mean sea level.
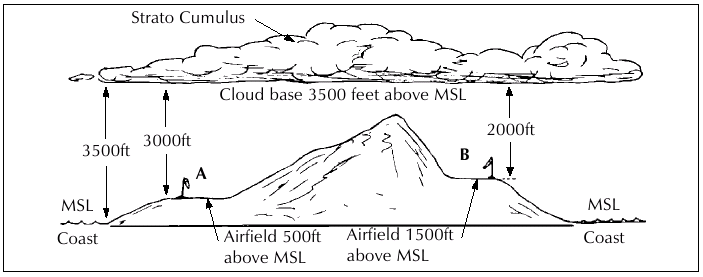
Fig. 97 In the above, if a flight route forecast was required for a coast to coast flight, the cloud base would be given as 3,500ft. A terminal for airfield A would give the cloud base as 3,000ft and for airfield B, 2,000ft.
Cloud Classification
| Class | Family | Abbreviation | Likely range of cloud base and tops |
|---|---|---|---|
| High | Cirrus | Ci | 20,000 to 40,000 |
| Cirro�stratus | Cs | 20,000 to 40,000 | |
| Cirro�cumulus | Cc | 20,000 to 40,000 | |
| Medium | Alto�cumulus | Ac | 7,000 to 20,000 |
| Alto�stratus | As | 7,000 to 20,000 | |
| Low | Nimbo�stratus | Ns | 1-�2,000 to 2-�7,000 |
| Stratus | St | 500 to 2-�4,000 | |
| Strato�cumulus | Sc | 1-�2,000 to 2-�4,000 | |
| Marked vertical | Cumulus | Cu | 1-�3,000 to 7,000 development |
| Marked vertical | Towering Cumulus | TCu | 1,000 to 10,000 development |
| Marked vertical | Cumulo�nimbus | Cb | 500 to 20-�40,000 development |
Strato or stratus refers to a layer type cloud. Nimbo or nimbus' refers to a type of rain producing cloud.
Cloud consists of water droplets or ice crystals or a mixture of both. At temperatures above 0 degrees C (freezing point), clouds consist almost entirely of water droplets, whereas at lower temperatures and at cirrus cloud level, ice crystals predominate.
Water droplets do not necessarily freeze immediately the air falls below freezing point. Small droplets can persist to temperatures as low as �40 degrees C and are called supercooled. They are the most common cause of airframe icing.
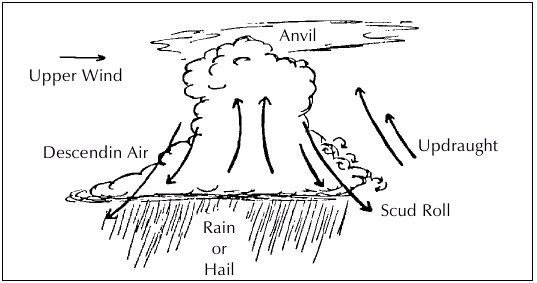
Fig. 98 Cumulo Nimbus Cloud and associated turbulence.
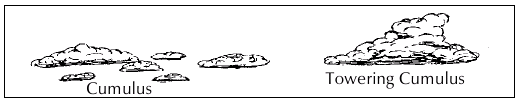
Fig. 99 Cumulus types indicate instability in the atmosphere, thermal activity.
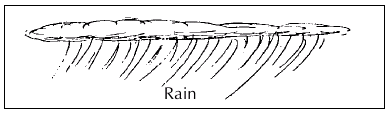
Fig. 100 Nimbo � stratus. Fairly continuous layer, often dark looking with widespread rain.
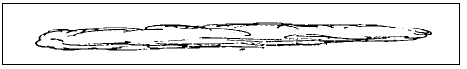
Fig. 101 Stratus. Fairly continuous layer. Smooth conditions.
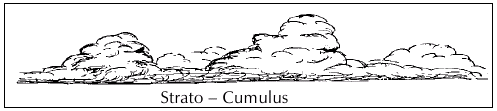
Fig. 102 Fairly continuous layer with cumulus type development.
Figs. 100-�102 are stratus type clouds which are often in contact with the terrain.
Cold Front
When a cold air mass is displacing a warm air mass, then a cold front is said to exist at the intersection. Cold fronts usually travel at around 10-15 knots, and pass fairly quickly. It is preceded by cumulus and cumulonimbus clouds forming a "rain belt" usually some 50-60 miles through.
Flying conditions prior to the cold front are usually increasingly turbulent, with generally high cloud and good visibility. As the front passes there is likely to be heavy rain- perhaps hail and thunder. The wind may veer a little with squalls dying out as the front passes. Behind the front the weather will be quite good with good visibility and ceilings.
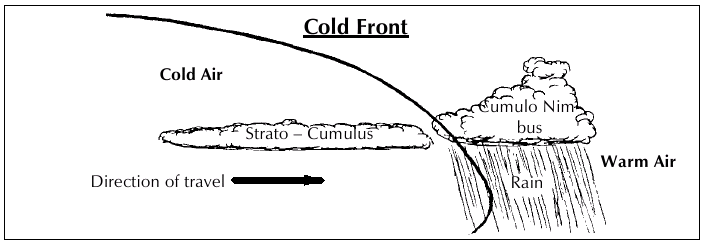
Fig. 103
Warm Front
When a warm air mass displaces a cold air mass, then a warm front is said to exist at the intersection. Warm fronts pass slowly and are preceded by some 500-600 miles by cirrus and cirro�stratus cloud. As the front approaches, the cloud will thicken and the base will lower. Rain will usually begin 250-�300 miles ahead of the front.
Flying conditions prior to the front are not good, with poor visibility, rain and possible airframe icing. As the front passes the rain or snow may stop or reduce but visibility will remain poor, often with fog or mist.
Behind the front the weather will be fair or drizzly with continuous poor visibility. Fog or mist may remain.
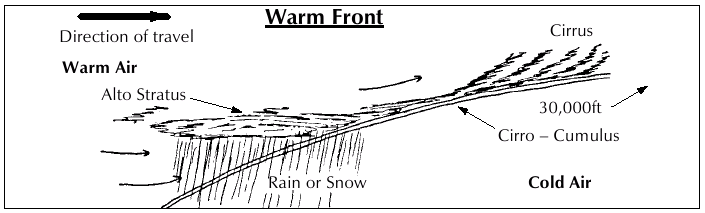
Fig. 104 At times a front may remain stationary, it is then known as a stationary front. It is represented on a synoptic chart by an alternate red and blue line or by:

Fig. 105 Stationary front
As a cold front moves at a higher speed than a warm front, it is common for the cold front to overtake the warm front. The front is then said to be occluded. It will then slowly disperse. It is represented on a synoptic chart by a double red and blue line or by:

Fig. 106 Occluded Front
Fog (Radiation Fog)
Fog is really only cloud formed close to the ground. Fog occurs on cold clear nights in settled weather with a wind of less than 10 knots.
During the night the Earth's surface cools rapidly and cools the air in contact with it.
- If the dew point of this air is reached, dew will form on the ground.
- If there is a wind of less than say 10 knots, fog will form.
- If there is more than 10 knots of wind, low stratus cloud will form.
If fog forms it will tend to thicken for a period around sunrise due to the mixing of air by convection currents. It may also increase as the air continues to cool until the sun is well up in the sky. Once the temperature rises above the dew point of the air, the fog will disperse. If there is cloud cover above the layer of fog, the fog may persist for a long period �perhaps all day.
Any microlight pilot who considers taking off with the intention of climbing above the fog and expecting it to disperse by the time he lands is not only breaking regulations, but is asking for trouble. It is impossible to gauge the thickness of fog from the ground, and it could easily be several thousand feet thick, despite the tempting blue "holes" one can sometimes see.
Furthermore, even if he managed to control the microlight long enough to get "on top" without reference to the ground he will soon be lost and the fog may last longer than the fuel supply! The tendency is to not take fog seriously and this is sad because it holds the same dangers as any other cloud flying. (See Cloud Flying section.)
General Weather
Getting to grips with meteorology may seem a difficult task initially and it is in fact a very complex and diverse field, but the microlight pilot who has the basics along with good observation skills can soon become a good judge of weather. Don't just look at the sky on days you are about to go flying. Evaluate the weather every day by listening to radio forecasts, looking at newspaper and TV predictions, and relating this to your own observations. Become a habitual sky�watcher, noting wind direction and strength along with cloud development as the day progresses. On days with cumulus developments for example, you can watch the cycle of the cloud's birth, growth and decay. Some days you will observe the growth of many cumulus to form a continuous layer as they merge together. This is called over development. With the sun blocked out, the thermal source of this growth is cut off, and the cloud decays to begin the cycle again.
Such things go largely unnoticed by the public, but the microlight pilot should develop a weather eye that notes what is happening in the atmosphere every day. Those newspaper weather maps provide an interesting study. For an exercise, cut out and keep each days map for a couple of weeks and you can form a "cartoon strip" of the weather. Add your own observations each day and see how this fits with the prediction.
A useful point to remember is that the closer together the isobars are, the stronger the wind will be at that place.